Wind and solar assets
Find the asset issues your SCADA alarms miss
Canopy learns normal behaviour from the SCADA and sensor data your assets already generate, then detects abnormal patterns early and puts MWh and revenue context behind every issue.
Book a walkthrough
No new hardware
Existing SCADA data only
The problem isn't lack of data
Most teams already have SCADA, alarms, dashboards, OEM portals, and spreadsheets. The gap is what still gets missed: weak patterns, below-threshold behaviour, and early degradation that does not trigger a clean alarm.
What teams have today
SCADA values and alarms
Static thresholds
Manual investigation
Technical alerts only
What Canopy adds
Abnormal behaviour below alarm thresholds
Changes that only matter under specific operating conditions
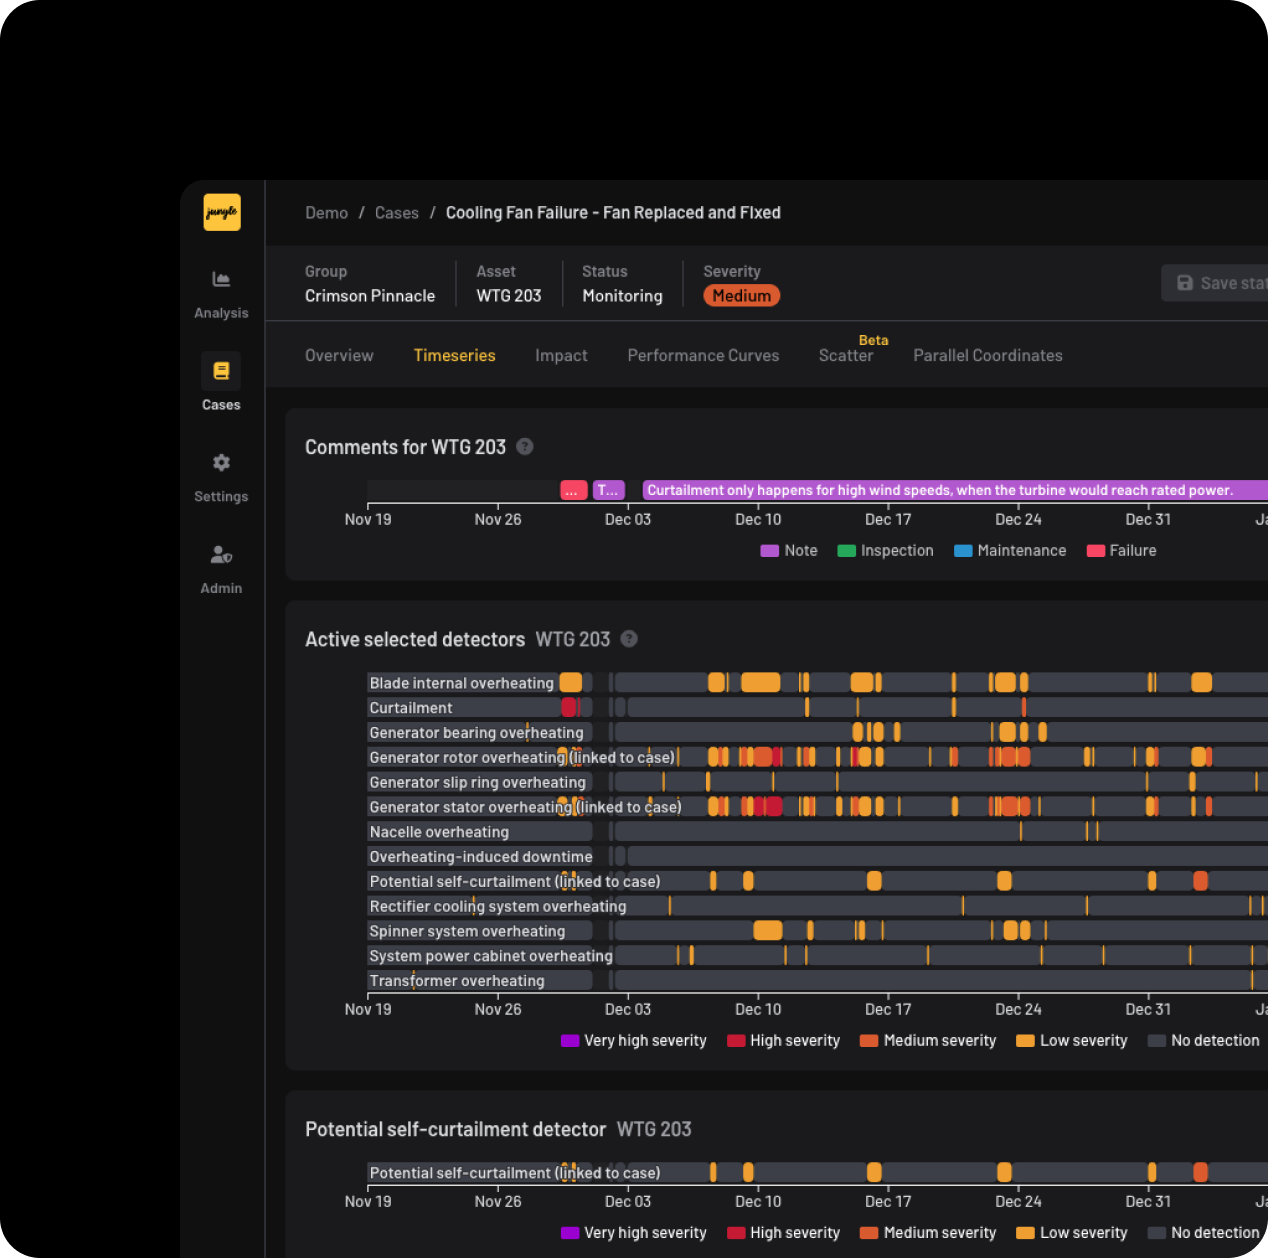
Evidence, severity, and operational context in one place
MWh and revenue context behind the anomaly
Canopy learns normal behaviour.
Then flags what changes
Weak patterns, below-threshold behaviour, and early degradation signals often stay hidden until they become obvious enough to trigger an alarm. By then, the issue may already mean component damage, downtime, or avoidable production loss.
01
Existing monitoring
Your teams already work with SCADA, alarms, dashboards, OEM portals, and spreadsheets. The signals exist, but weak patterns can still stay buried.
02
Canopy layer
Canopy learns expected asset behaviour, detects abnormal patterns below fixed thresholds and connects them to severity evidence and impact.
03
Prioritised action
Teams get decision-ready cases with MWh and revenue context, so they know which issues need attention first.
"Thanks to Canopy, we can now proactively identify potential issues ahead of our daily operation management tools, preventing downtime that would have otherwise grown increasingly under the surface."
Jesper van Vliet, Technical Asset Manager, Windunie
The methodology
Static thresholds can't keep up with changing conditions
Traditional monitoring uses fixed limits that stay the same no matter what's happening on site.

Canopy uses machine learning models developed in-house to learn how each asset should behave under real operating conditions, and flags when live behaviour drifts from that baseline, often before a standard SCADA alarm fires.
Book a demo
See Canopy work on
real fleet data
From abnormal behaviour to impact, evidence, and cases your team can act on.
Detect developing issues
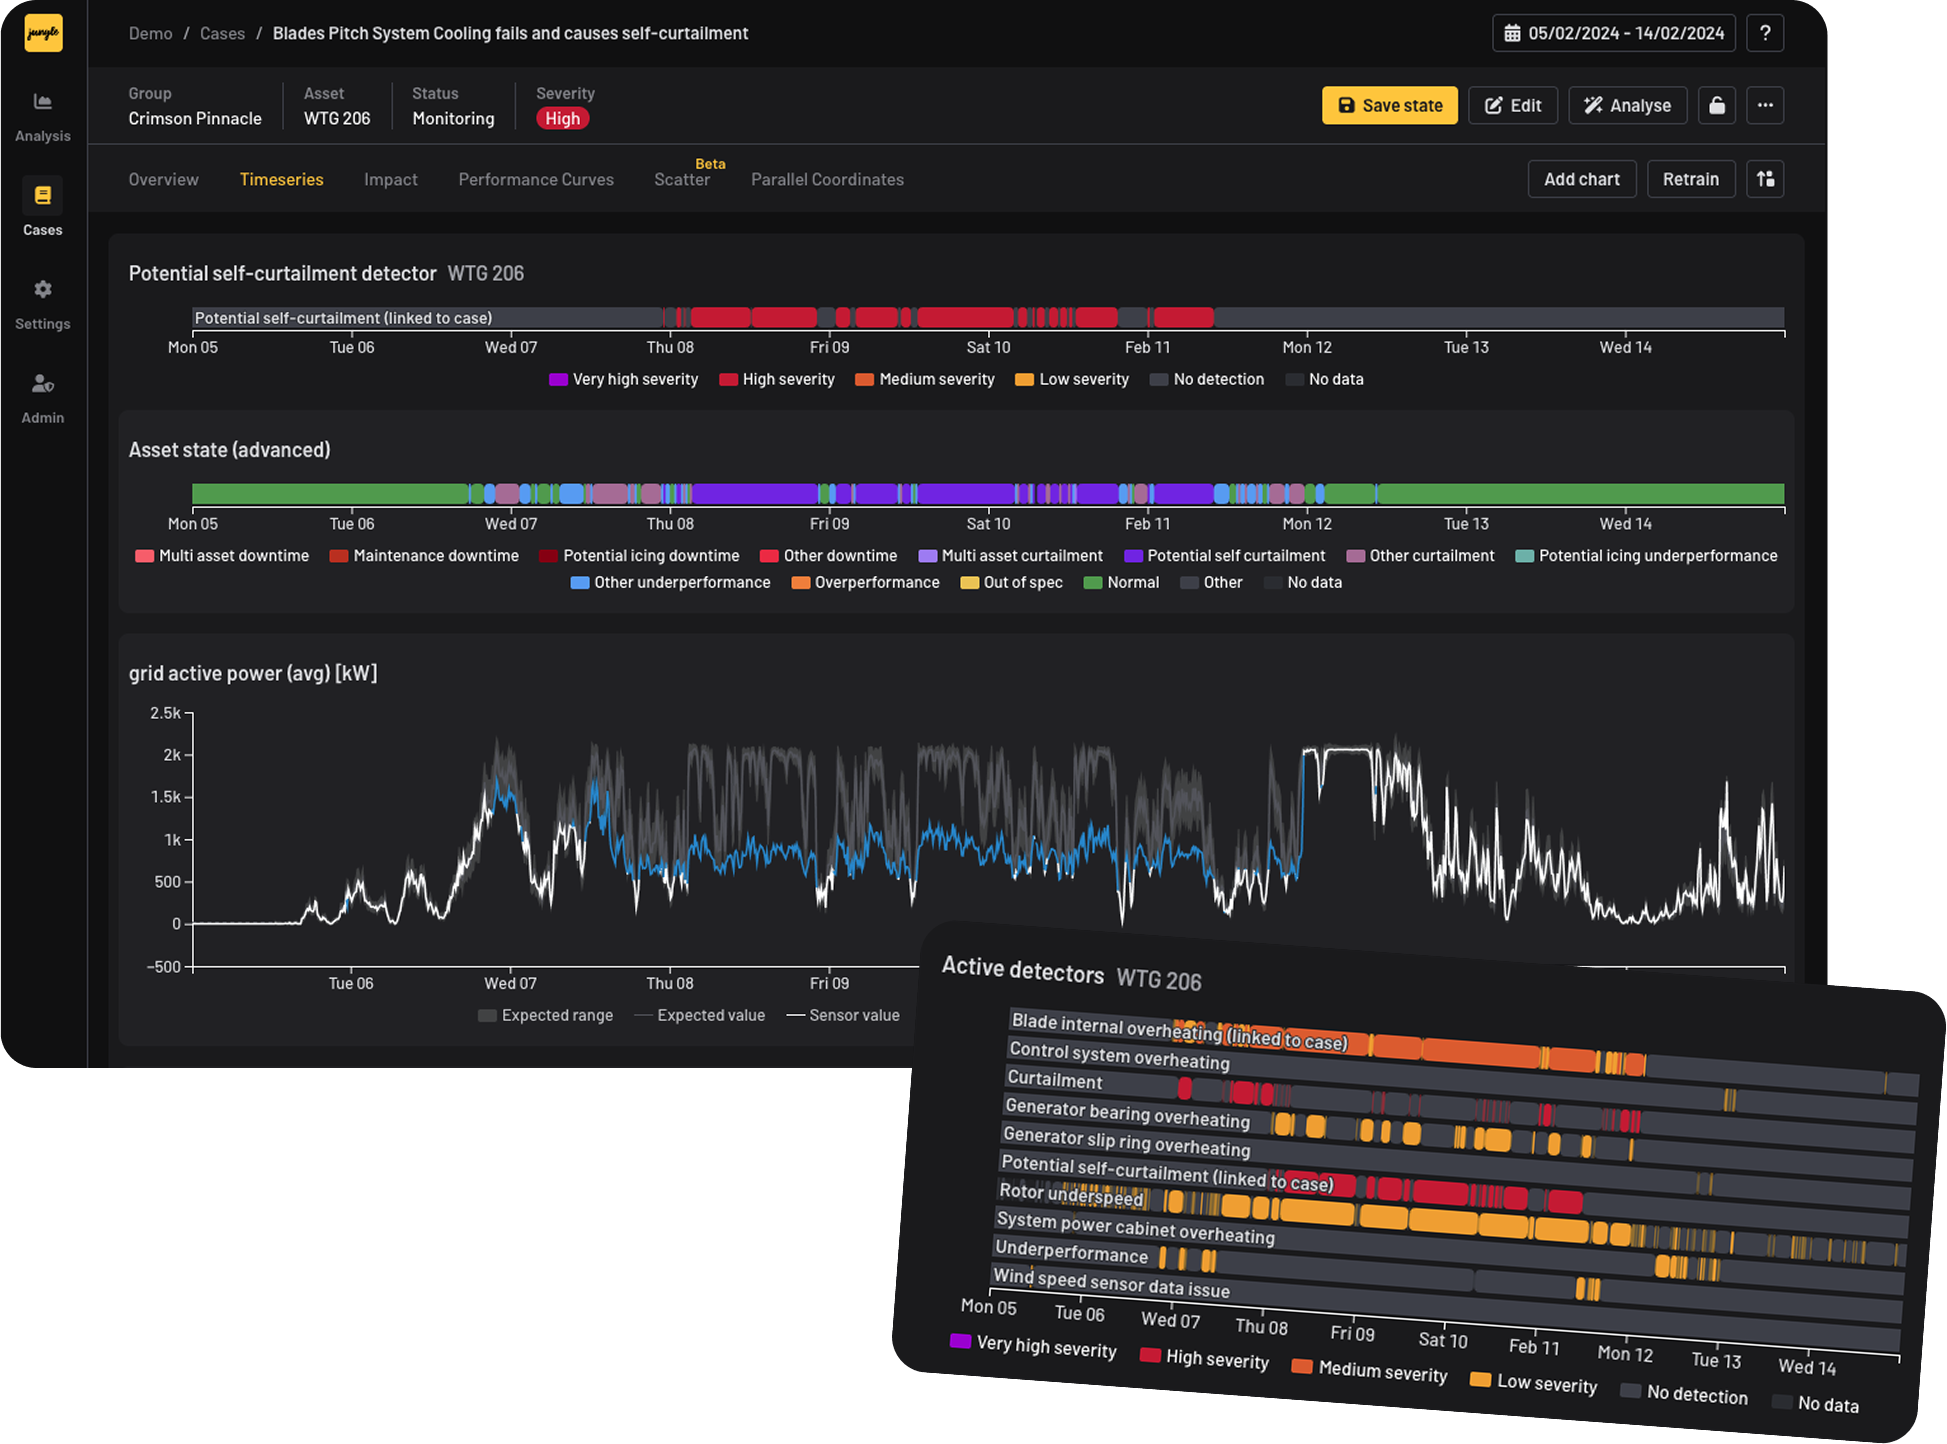
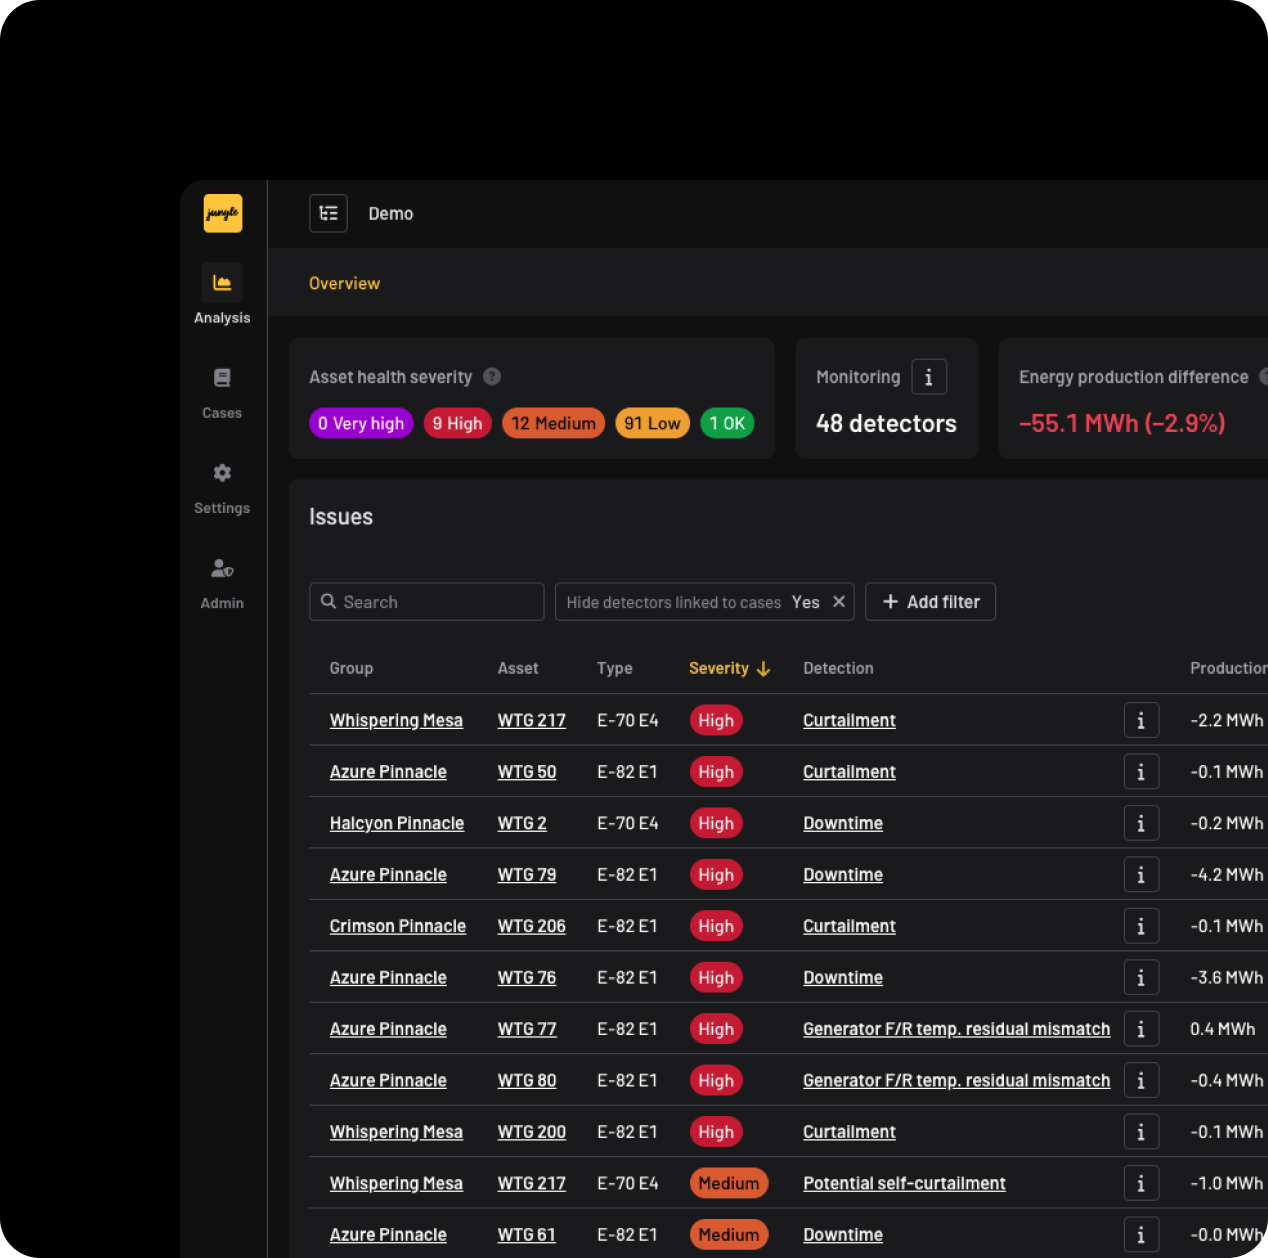
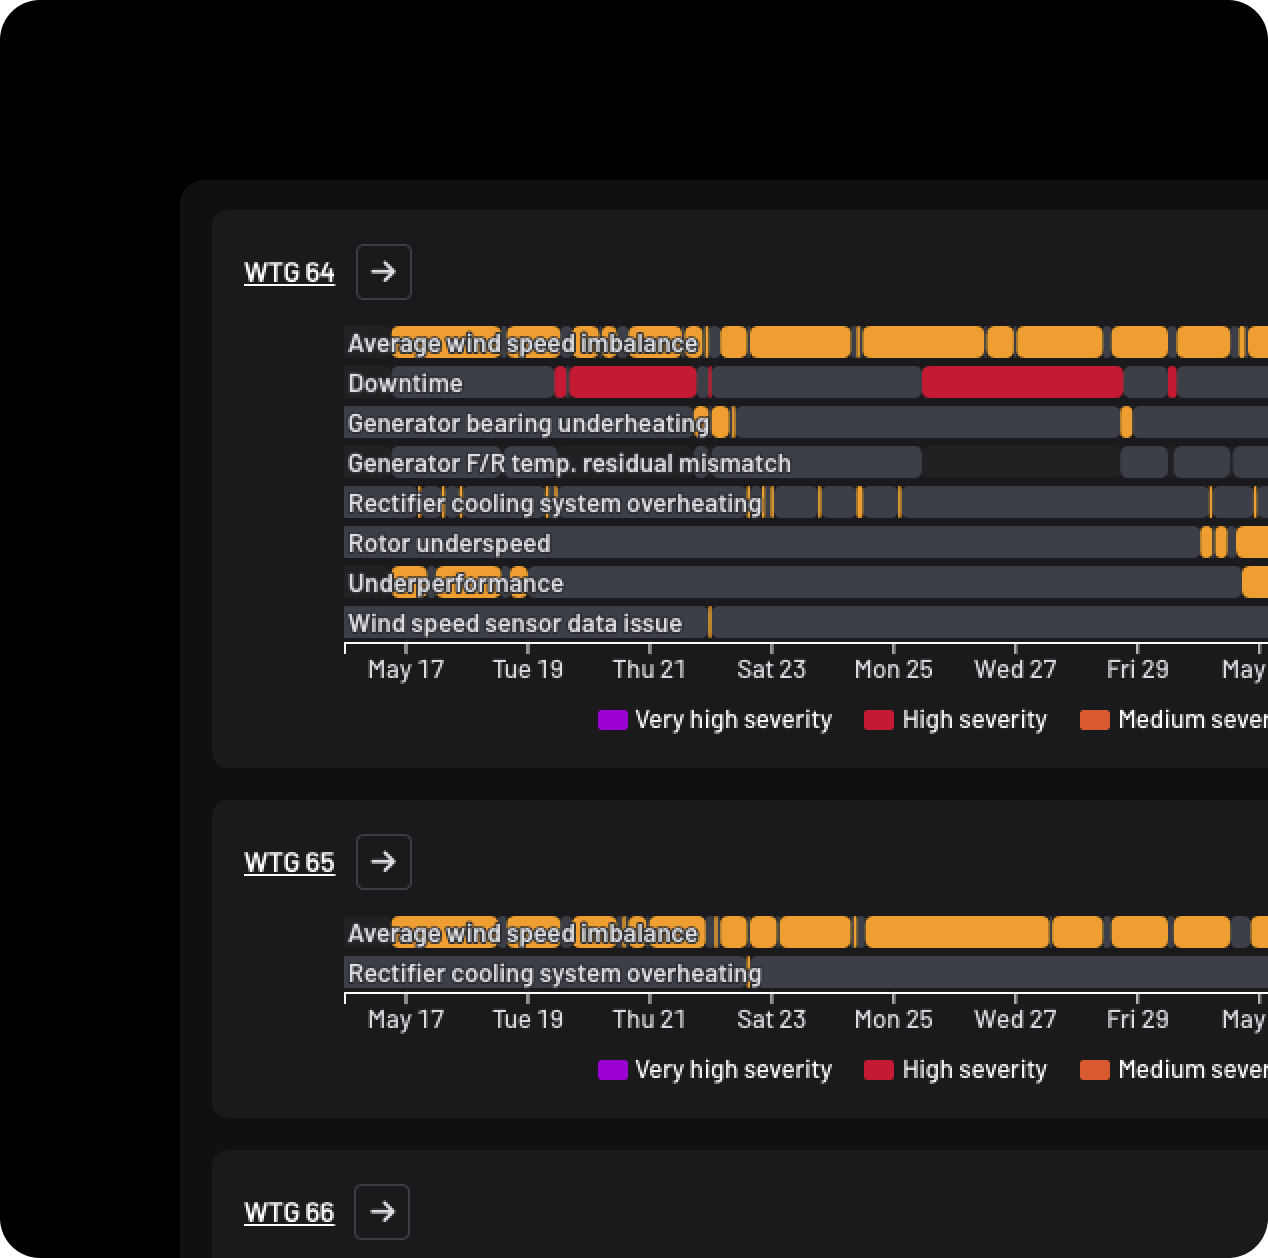
Canopy surfaces developing faults, abnormal behaviour, and performance issues across your fleet before they appear in standard alarms or monthly reports.
Flag context-sensitive anomalies
Canopy flags behaviour that deviates from what is expected under current operating and ambient conditions, not just values that cross fixed limits.
Quantify production impact
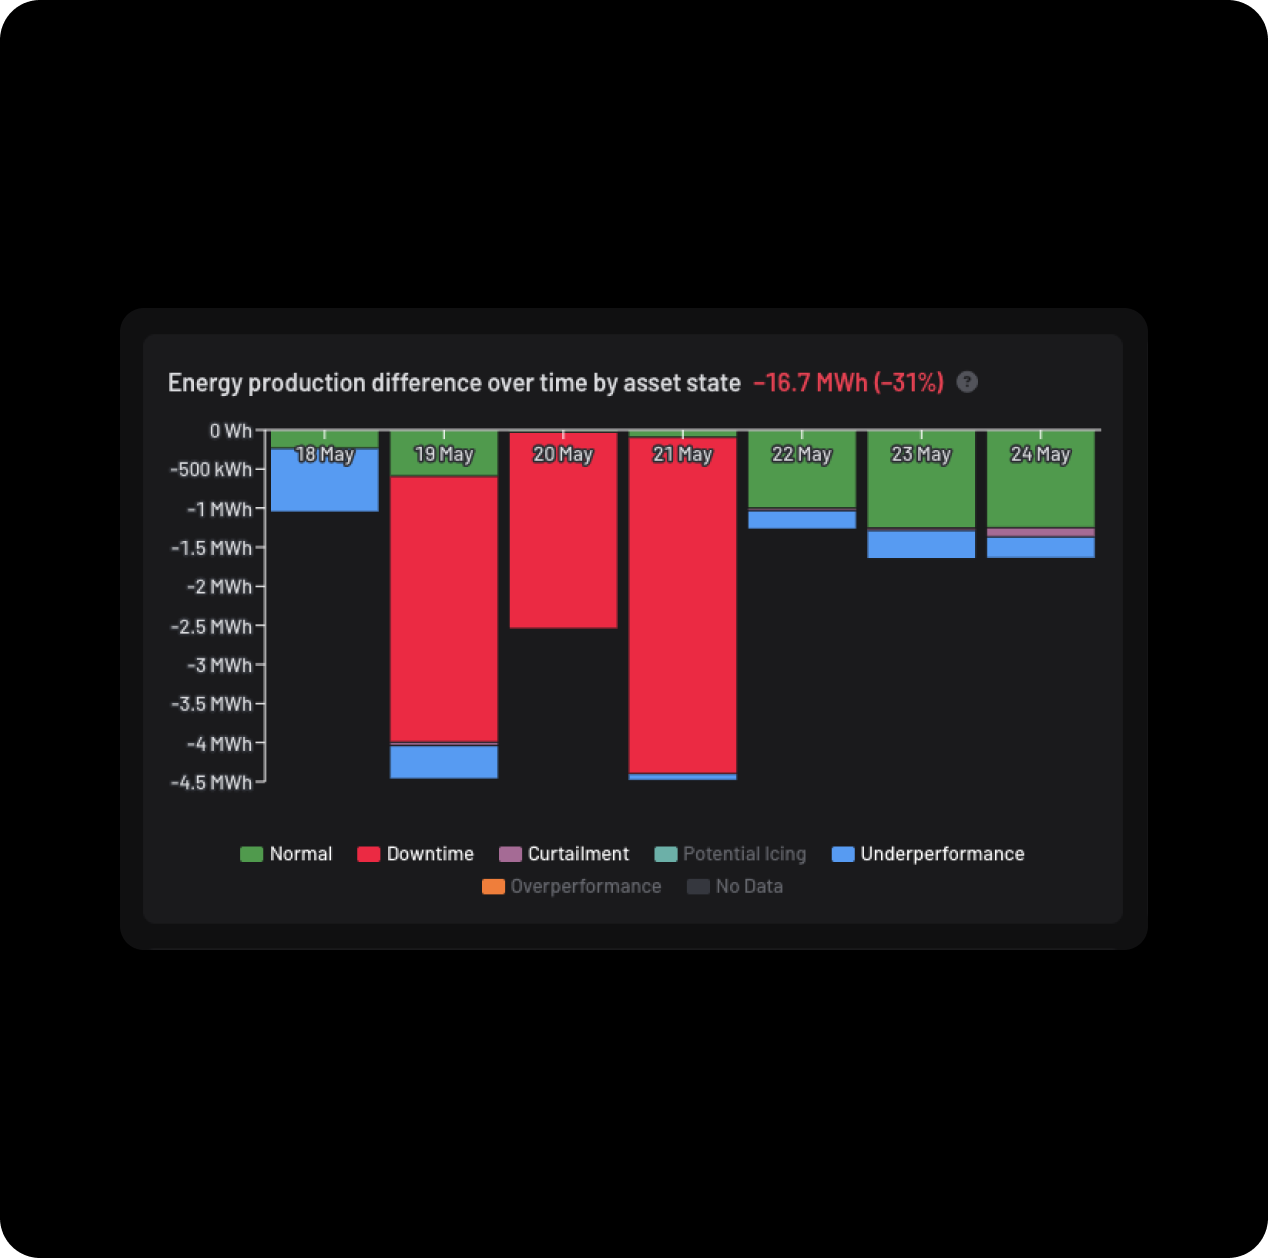
Detections are connected to MWh and revenue impact, so teams can understand which issues are worth acting on first.
Investigate to the sensor level
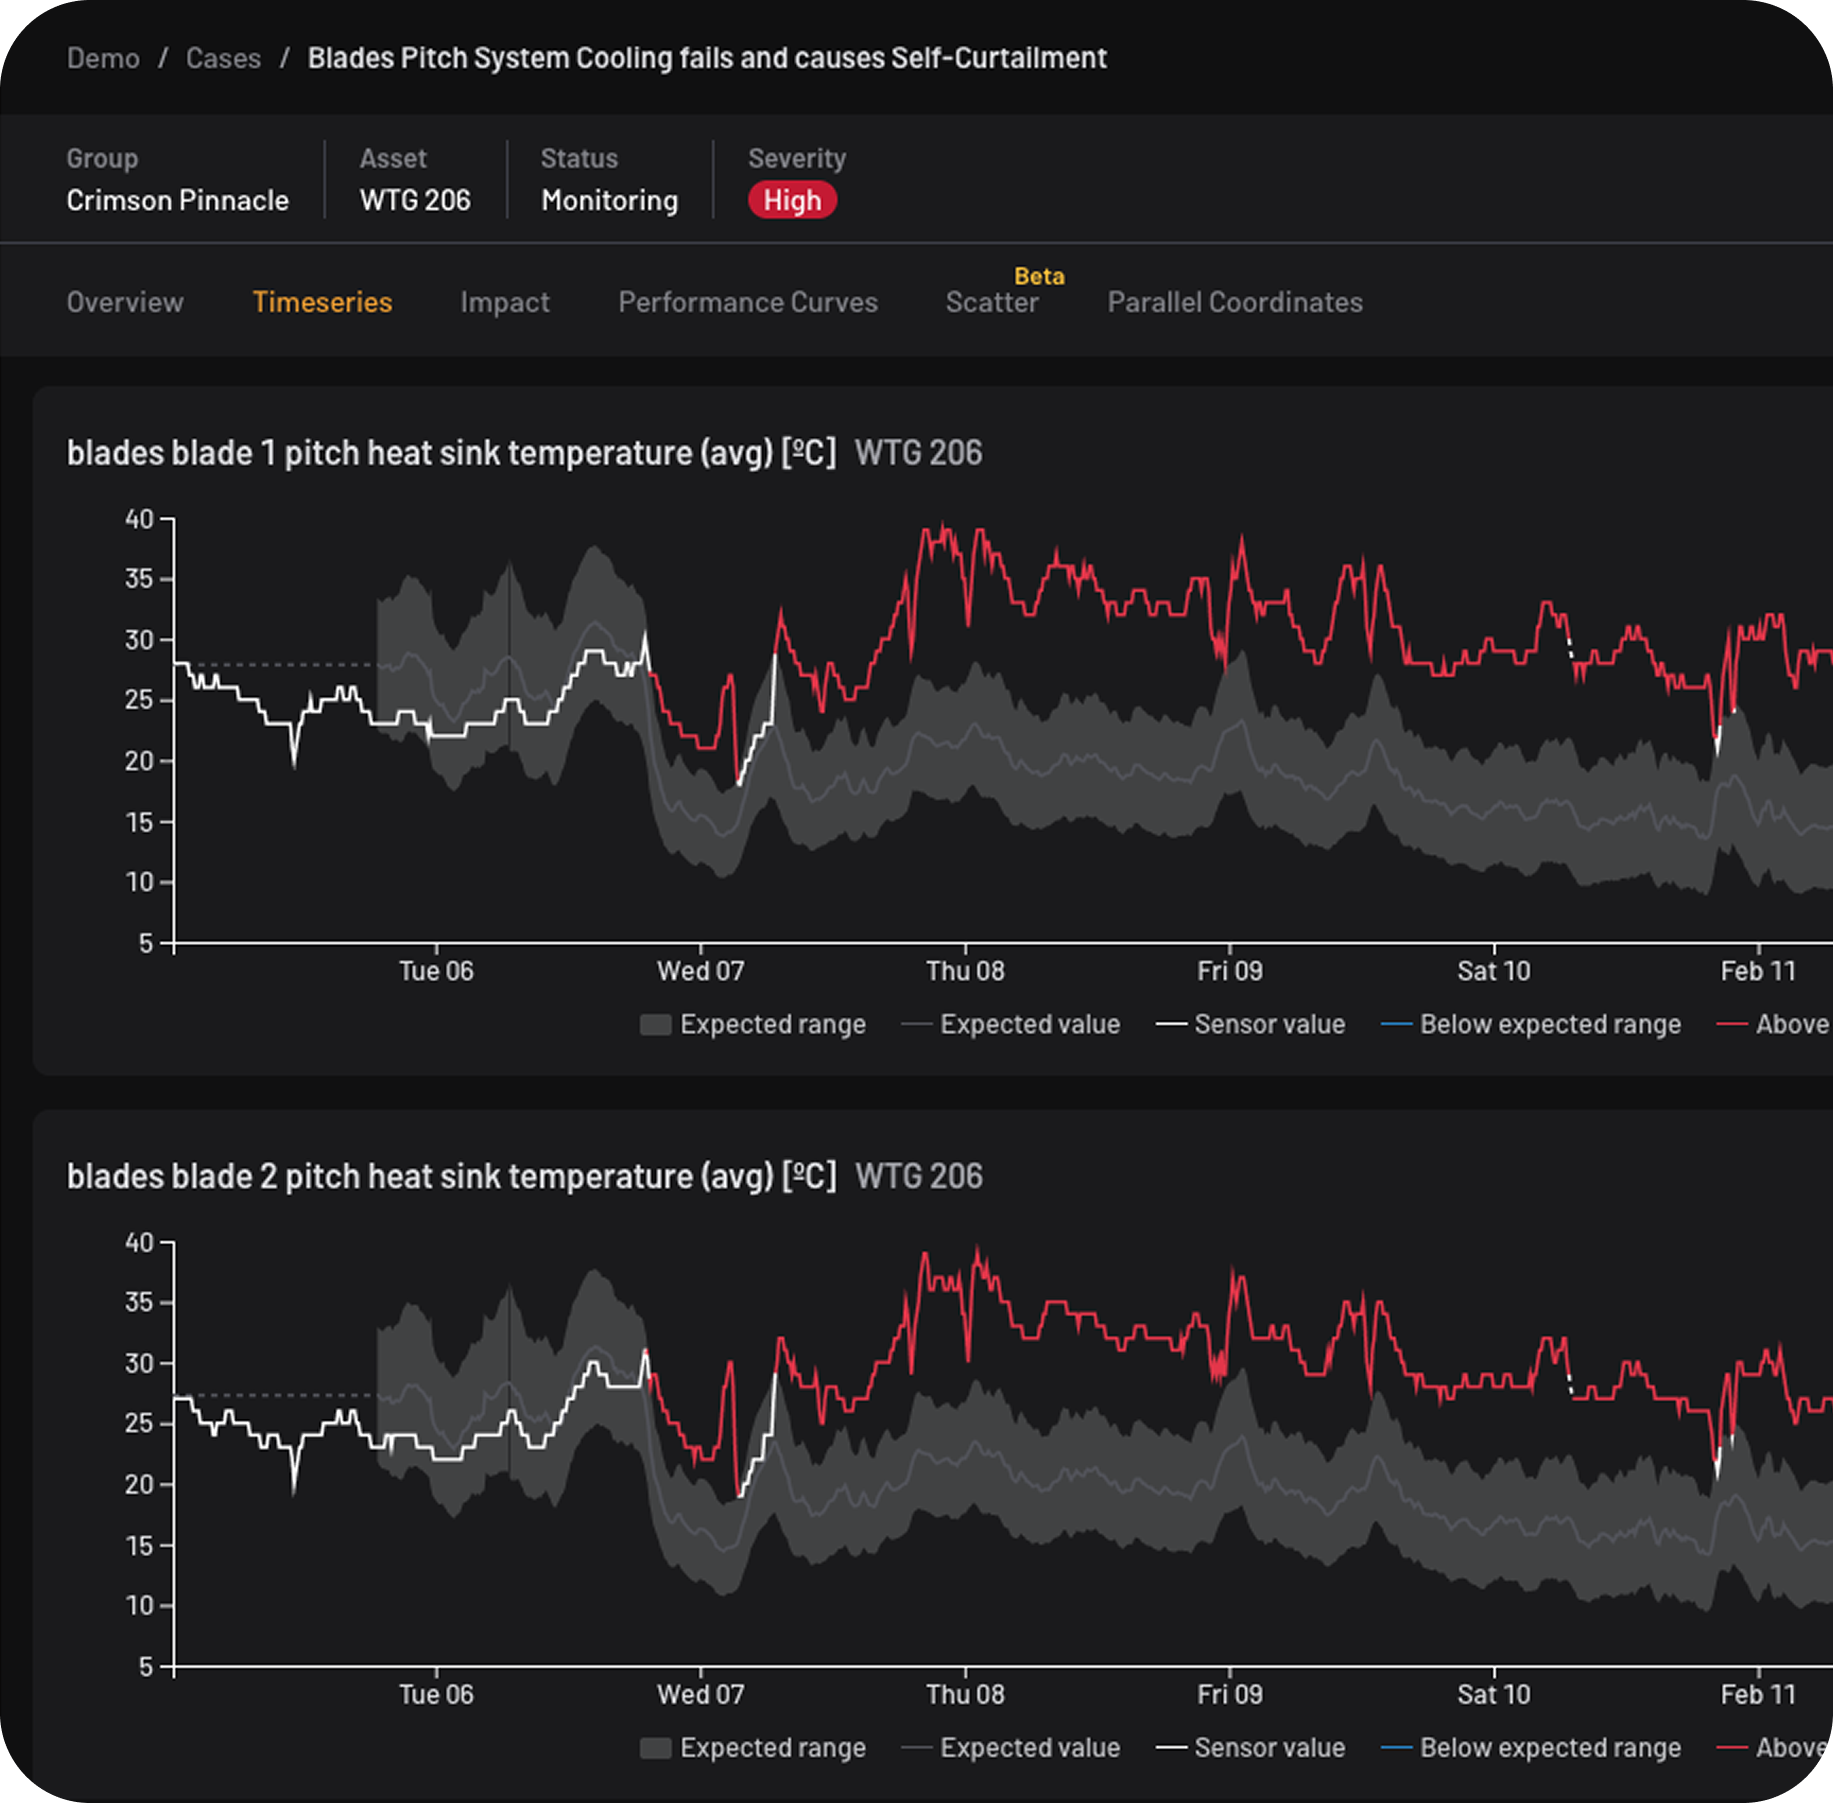
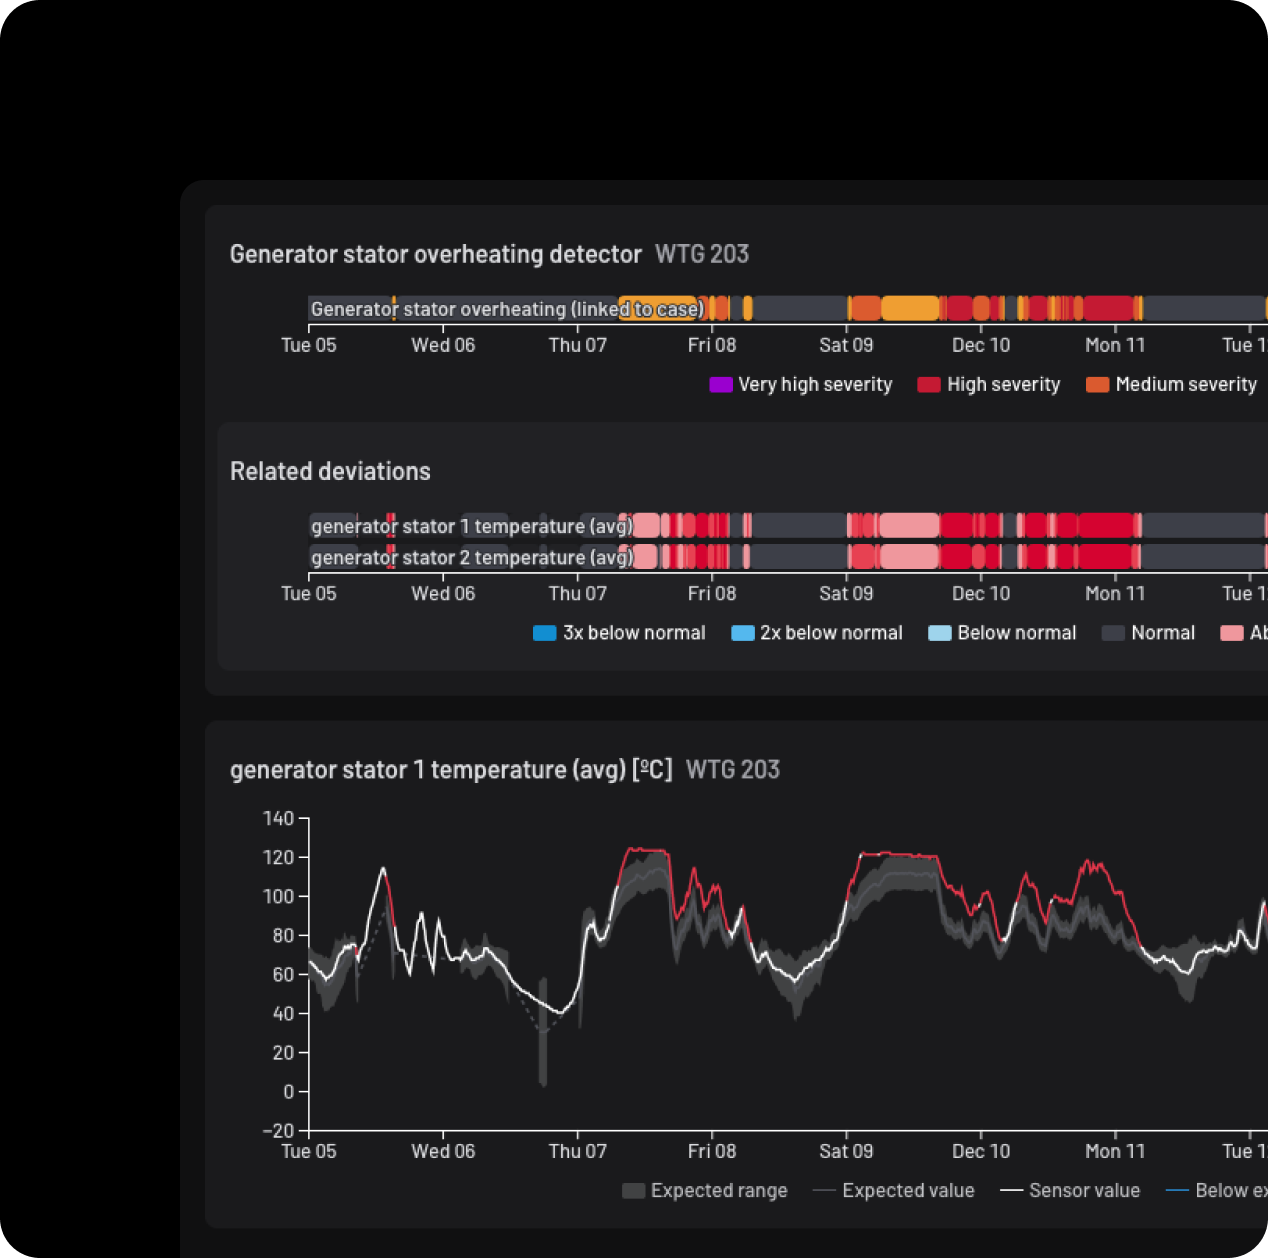
Investigate abnormal behaviour with normality curves, model outputs, and sensor-level evidence down to individual component readings.
Analyse fleet performance
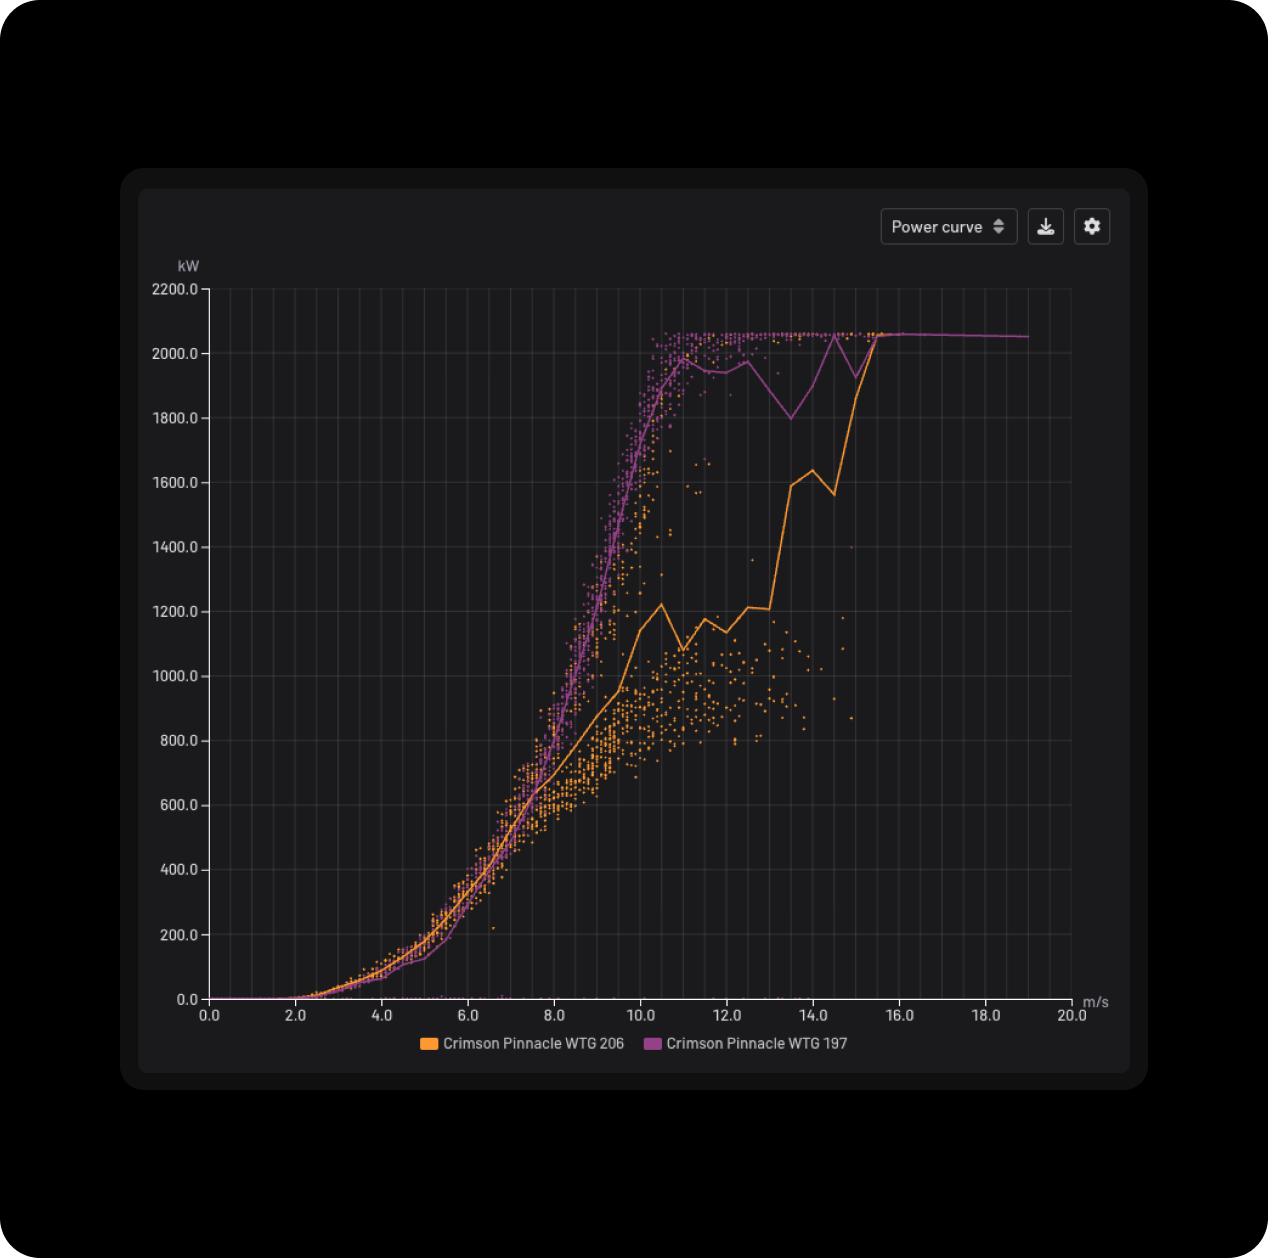
Compare asset behaviour across multiple sensors and operating conditions to find underperformance patterns that standard dashboards often leave buried.
Coordinate action through cases
Detections become structured cases with evidence, severity, impact, and discussion history, so teams can align on the next maintenance or operational action.
“Canopy exemplified its predictive power by identifying abnormal turbine behaviour ahead of traditional monitoring tools.”
Justin van der Sman, Technical Manager RE, Ventolines
“We've been able to efficiently identify curtailment periods and accurately calculate losses.”
Francesco Miniello, Predictive Maintenance Manager Wind & Solar, Repsol Renovables
Business impact that shows up
on your bottom line
Canopy turns early detection into measurable value.
1%
Additional AEP
Average additional AEP seen across the customer base.
15-25%
Margin improvement
Potential margin improvement for many renewable assets.
Canopy detected a rotor bearing issue months before the threshold-based SCADA alarm. The team had time to plan the repair, avoid downtime and save significant production.
“Canopy gave us the lead time to make a strategic decision rather than a reactive one. By aligning this repair with the scheduled gearbox work, we didn’t just save on mobilization costs, we protected our availability for the high-wind season. That single insight secured roughly €190k in potential revenue.”
João Sardo
Head of Asset Management, Galp
What Canopy detects
across wind and solar assets
Canopy identifies abnormal behaviour across wind and solar assets before it becomes a production loss, repeated alarm, or unplanned maintenance issue.
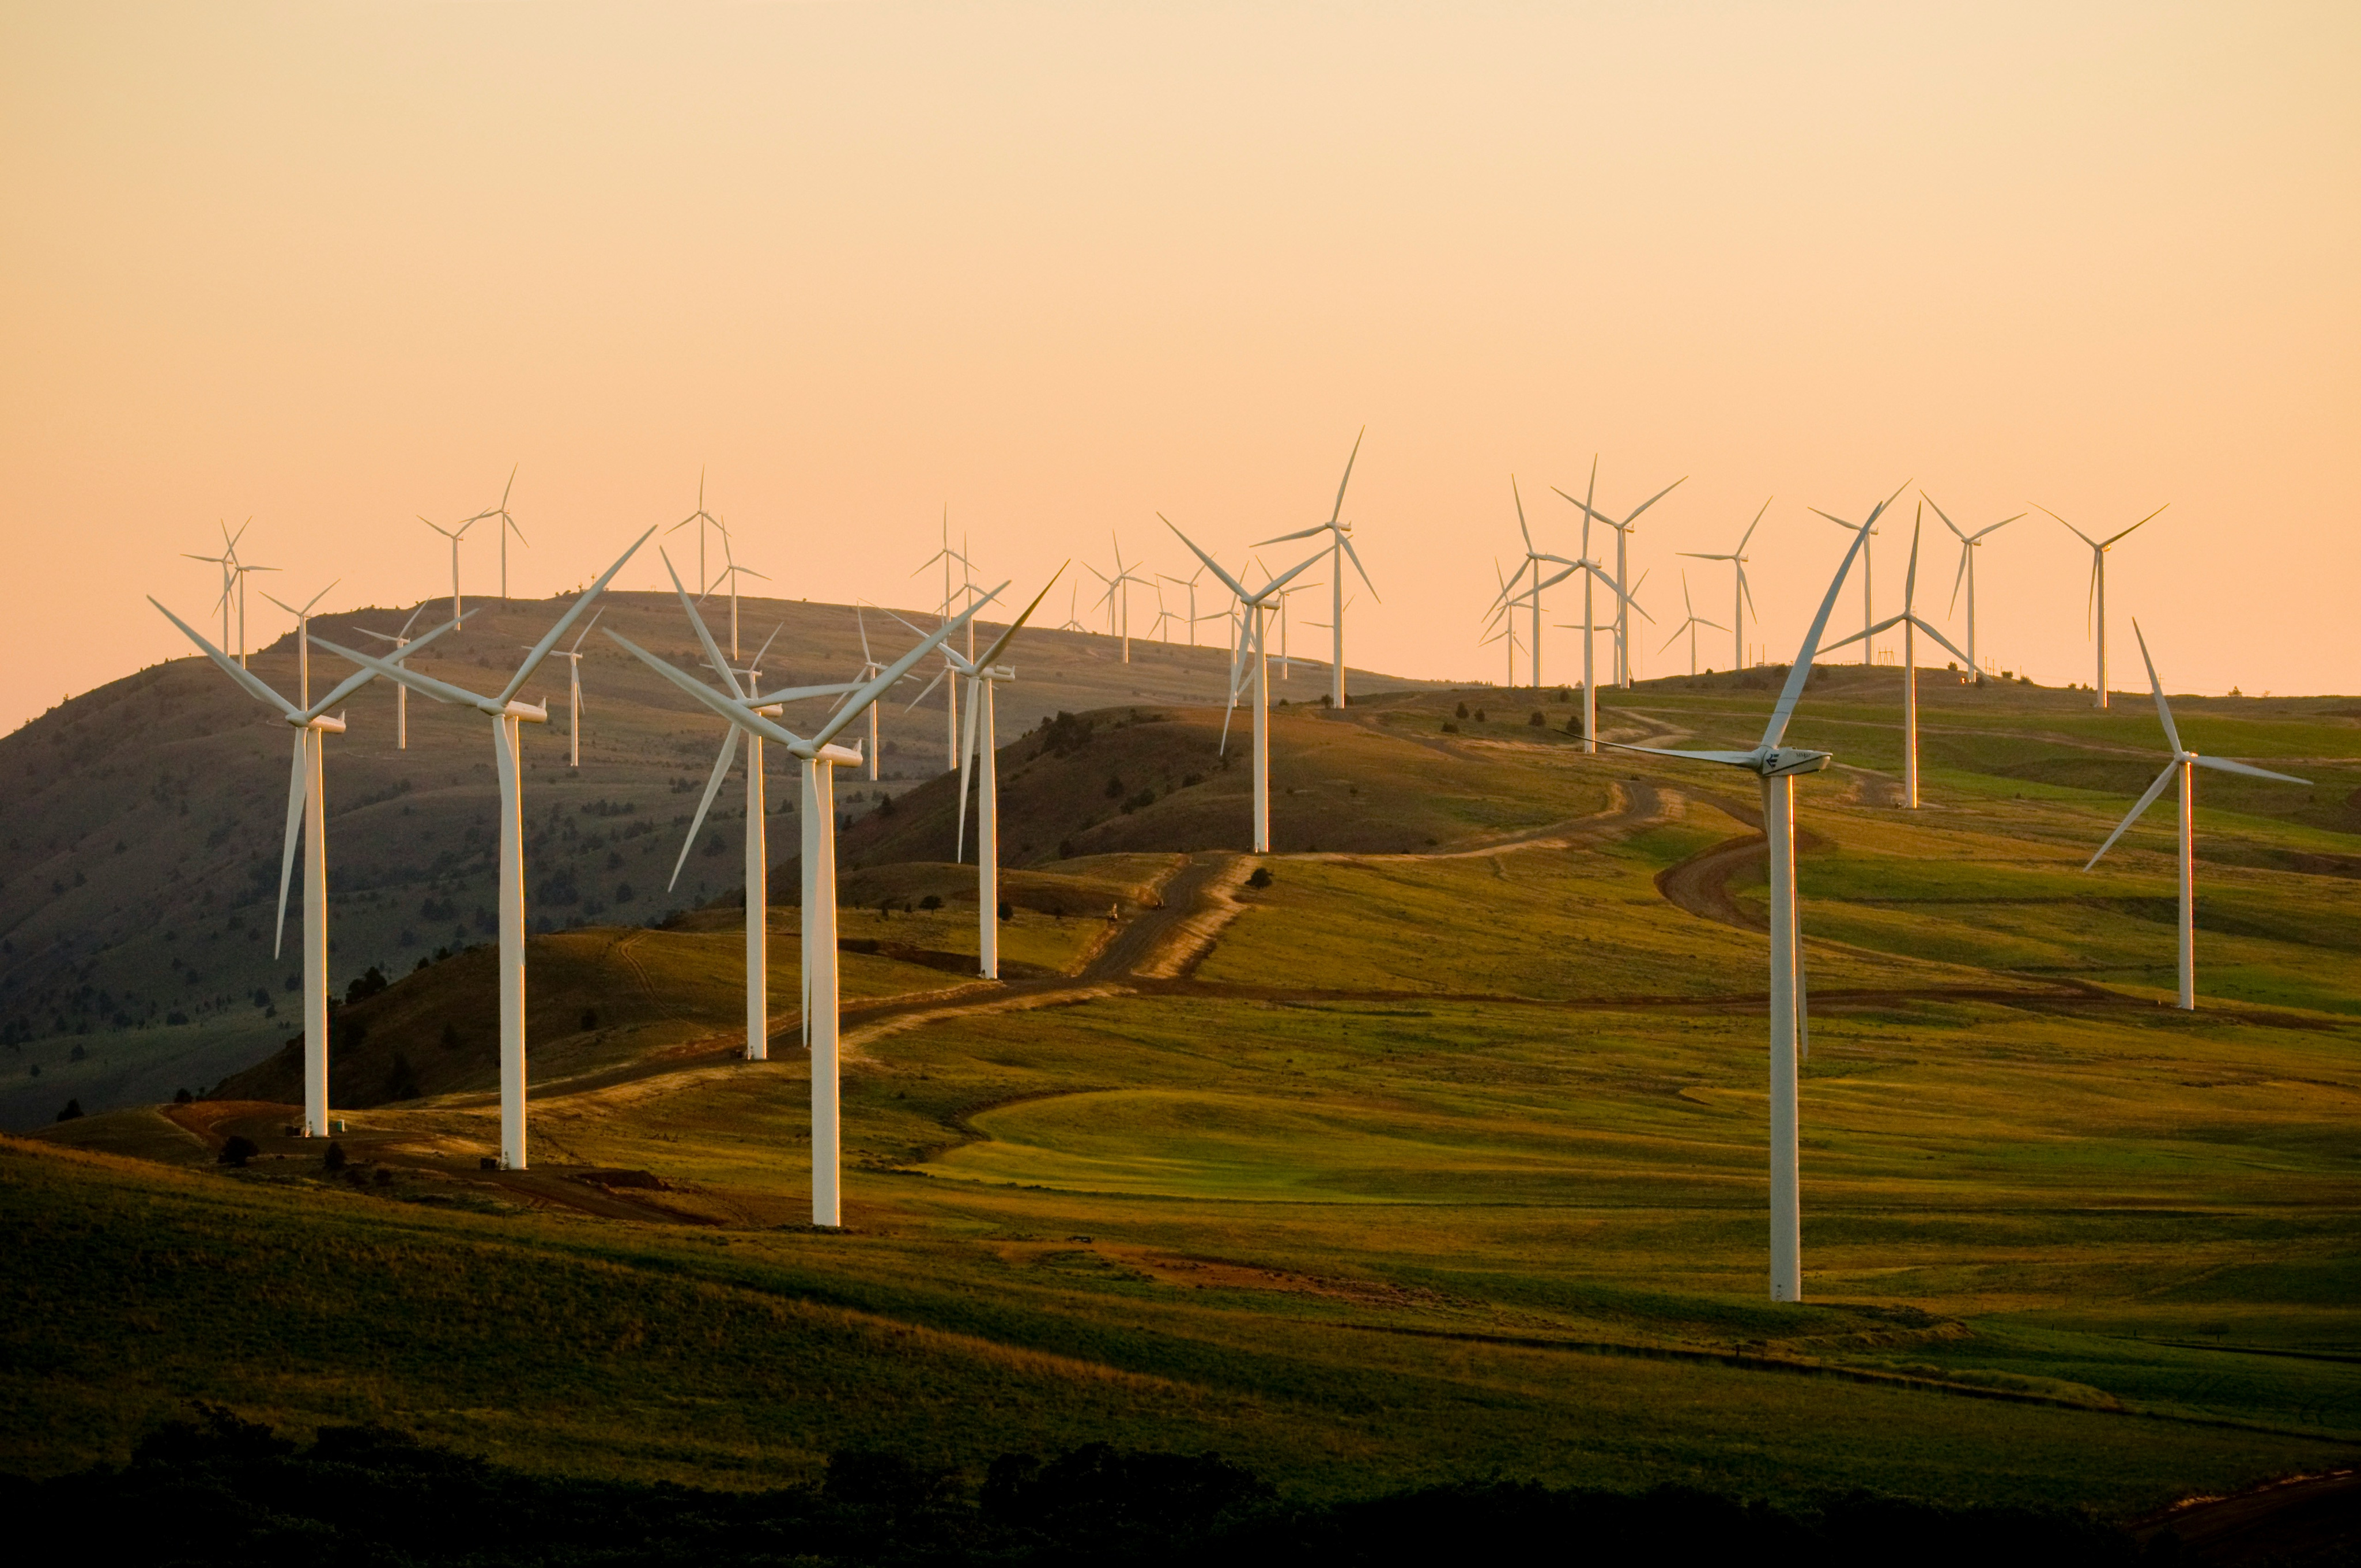
Wind
See how Canopy detects abnormal behaviour across onshore and offshore wind portfolios.
Rotor and generator bearing overheating
Gearbox bearing damage and radiator failure
Hydraulic system abnormalities
Pitch misconfiguration and control errors
Grid curtailment losses
Drivetrain and nacelle overheating
Turbine underperformance patterns
Post-maintenance deviations
Explore wind
Solar
See how Canopy detects abnormal behaviour across utility-scale PV portfolios.
Inverter overheating and self-curtailment
Snow cover and soiling losses
Tracker misalignment
String-level underperformance
Grid curtailment losses
Cooling system abnormalities
Explore solar
Built for the teams accountable
for renewable asset performance
Canopy turns early detection into measurable value.
Asset managers
O&M teams
Performance engineers
Operations teams
Technical directors
Finance and leadership
Asset managers
See which issues threaten availability, production, and revenue across your portfolio.
“Canopy gave us the lead time to make a strategic decision rather than a reactive one. By aligning this repair with the scheduled gearbox work, we protected our availability for the high-wind season.”
João Sardo, Head of Asset Management, Galp
O&M teams
Focus maintenance effort on the behaviours most likely to become downtime or production loss.
“Without Canopy, we would not have identified the issue until much later, after significant losses had already occurred.”
John McGillivray, Director, Africoast
Performance engineers
Investigate abnormal behaviour with model outputs, normality curves, and sensor-level evidence down to individual component readings.
“Canopy exemplified its predictive power by identifying abnormal turbine behaviour ahead of traditional monitoring tools.”
Justin van der Sman, Technical Manager RE, Ventolines
Operations teams
Reduce alarm noise and focus attention on the issues that need action now.
“Thanks to Canopy, we can now proactively identify potential issues ahead of our daily operation management tools, preventing downtime that would have otherwise grown increasingly under the surface.”
Jesper van Vliet, Technical Asset Manager, Windunie
Technical directors
Evaluate asset risk and implementation feasibility with read-only access, no hardware changes, and remote deployment.
“Canopy has proven to be a useful tool for anomaly detection and for the impact quantification of performance-related issues.”
Francesco Miniello, Predictive Maintenance Manager Wind & Solar, Repsol Renovables
Finance and leadership
Connect technical issues to MWh, revenue context, and the business impact of operational decisions.
“Within the TotalEnergies On Program, Jungle has been providing relevant insights in solar and wind farms across 3 different continents.”
Sophie Mouligneau, Program Director, TotalEnergies
Designed to fit into
existing operations
Canopy deploys remotely through a secure, read-only data connection.
It uses the data your assets already generate, requires no new hardware, and does not access live control loops.
01
Connect existing data
We securely connect to your existing systems and start ingesting data
02
Train normal behaviour
Our AI learns how your assets behave under all operating conditions.
03
Go live
Your team gets access to detections, impact views, and cases from day one.
04
Work with Jungle
We help you act on insights through cases, collaboration, and measurable impact.
No new hardware
Read-only access
Remote deployment
Typically live in 2-3 weeks
Frequently asked questions
Do we need to install specific sensors to get meaningful insights?

No, Canopy doesn't require special datasets or labeled input data. It leverages raw data from your existing sensors, eliminating the need for new sensor installations.

How long does it take to get started?

Typically, Canopy is up and running within two to three weeks, ensuring a swift and efficient deployment process and delivering value from day one.

How much data do you require?

Our models use historical sensor data to learn normal behaviour. In most cases, one year of historical data is enough to make very accurate predictions on the health and performance of your machines.

Do you provide Canopy integrations?

Yes! More and more customers have voiced the request to interact with our normality models and detections via API. Get in touch with our team if this is also of interest to your organisation.

Can you work with any type of machine?

Yes! Canopy's machine agnostic architecture allows it to work with a variety of machines. Our models learn unsupervised, which enables them to harness raw SCADA data, ensuring compatibility with different machine types and operational environments.

Case studies